Proberix Update: Better Aggregated Monitoring Reports and CSV Export
Proberix calculates and stores performance metrics for every probe result. This update improves how those metrics are reported, especially across longer time ranges, by adding calculation methods for aggregated monitoring data.
The goal is simple: make longer time ranges easier to read, while keeping the details close when you need to investigate.
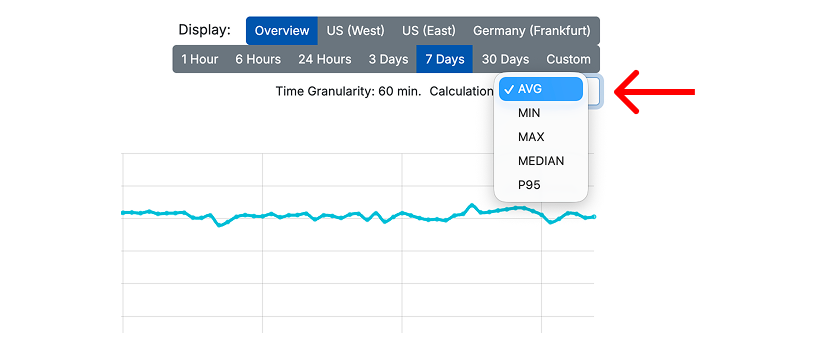
Calculation Methods for Aggregated Data
When you view a time range longer than 24 hours, Proberix groups results into aggregated time buckets. The reporting granularity is adjusted automatically based on the selected range and shown under the date range control. You can also choose how response time is calculated for each bucket:
- Average
- Minimum
- Maximum
- P95
- Median
This makes the chart more useful depending on what you are investigating. Average is good for the overall trend, P95 helps reveal slower user experiences, and maximum can show short but important spikes.
For more details, see Viewing Monitoring Data in Proberix.
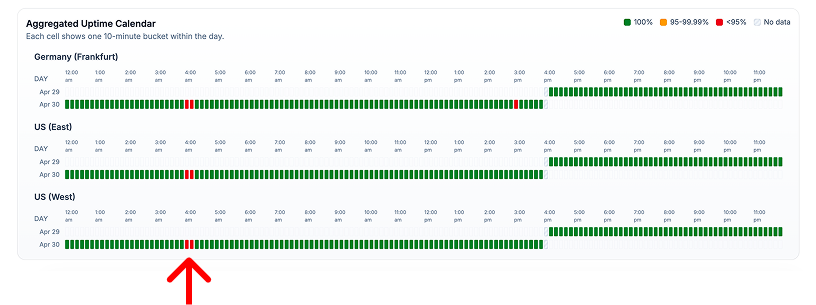
Aggregated Uptime Calendar
Aggregated data now includes an uptime calendar that adapts to the selected range, grouping results by day or hour based on the current granularity.
Each cell represents one aggregated time bucket:
- Green means full uptime
- Yellow means degraded uptime
- Red means a more serious availability drop
This makes it easier to spot patterns, recurring issues, and location-specific problems without reading every individual check.
Yellow and red buckets are interactive. Click one to drill into the raw results for that exact period, then return back to the aggregated view.
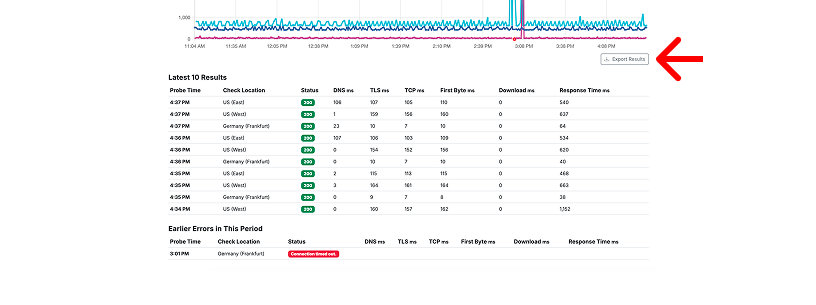
Latest Checks, Earlier Errors, and Export
The probe details page now keeps recent activity easier to scan. Under the chart, Proberix shows the latest checks first. If there were earlier errors in the selected period, they are surfaced separately below the latest checks.
This helps you see what is happening now without losing sight of important failures that happened earlier.
For the full selected period, the chart area now includes Export Results, so you can download the results as a CSV file.
This is useful when you need to:
- Share monitoring evidence with a customer or teammate
- Attach data to an incident report
- Analyze uptime and latency outside Proberix
- Keep a record of a specific investigation window
These changes keep Proberix focused on what matters most: readable monitoring data, quick investigation, and simple reporting when you need to share what happened.